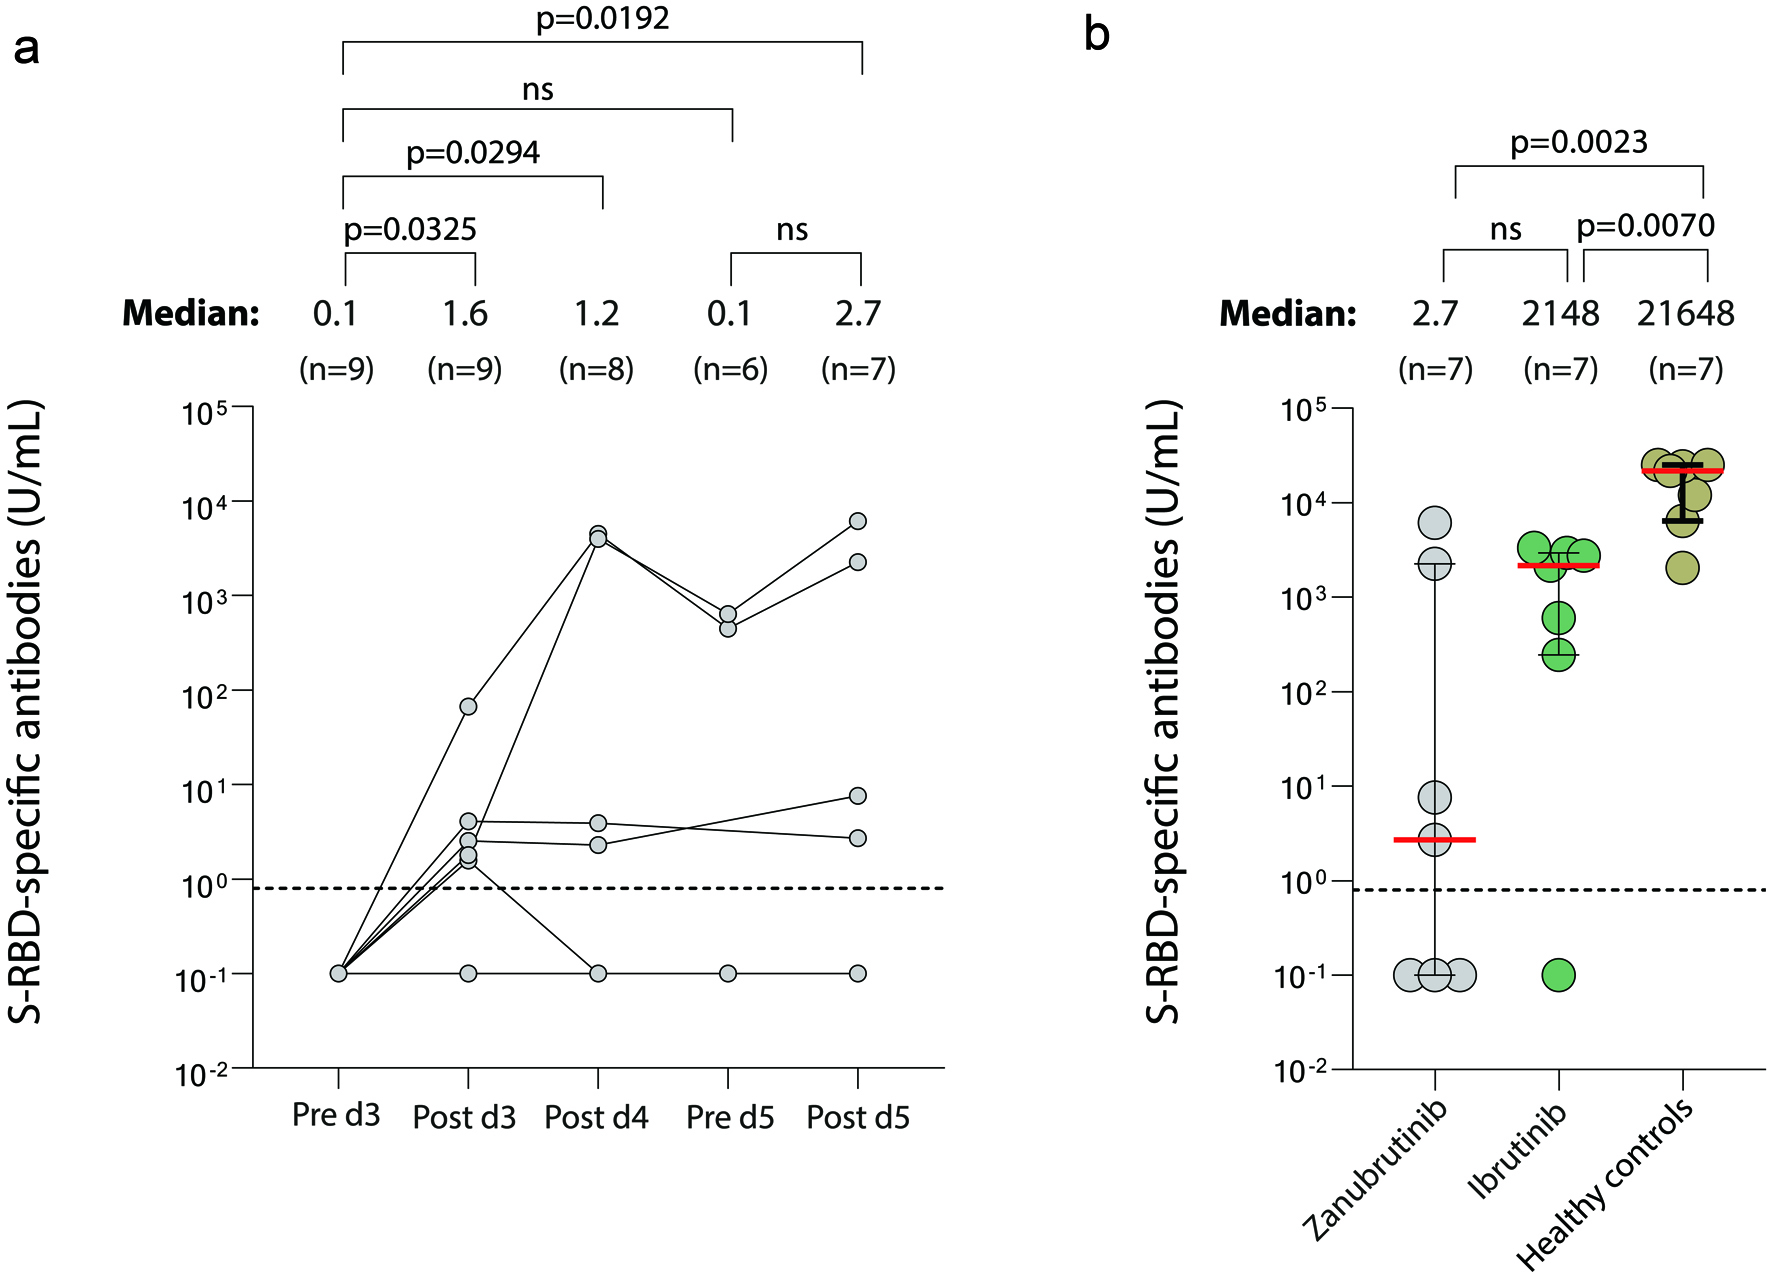
Figure 1. Serological immunity in zanubrutinib- and ibrutinib-treated patients with CLL after SARS-CoV-2 vaccination. Levels of SARS-CoV-2 Abs against spike-receptor-binding domain (RBD) were quantified in serum samples from zanubrutinib treated patients pre- and post-vaccine dose 3, post-dose 4, and pre- and post-dose 5 (a), and in addition post-dose 5 in PBMC from seven ibrutinib-treated patients and seven age- and gender-matched healthy donors (b). The median level of reactivity and number of samples are indicated above each time point. Dashed line represents positive threshold of 0.8 U/mL and the upper limit of detection is 25,000 U/mL. Error bars represent the median (red line) and interquartile range where applicable. Non-parametric Kruskal-Wallis test was used to assess differences between all-time points and Mann-Whitney test for comparison between patient groups and healthy controls. CLL: chronic lymphocytic leukemia; PBMC: peripheral blood mononuclear cell.
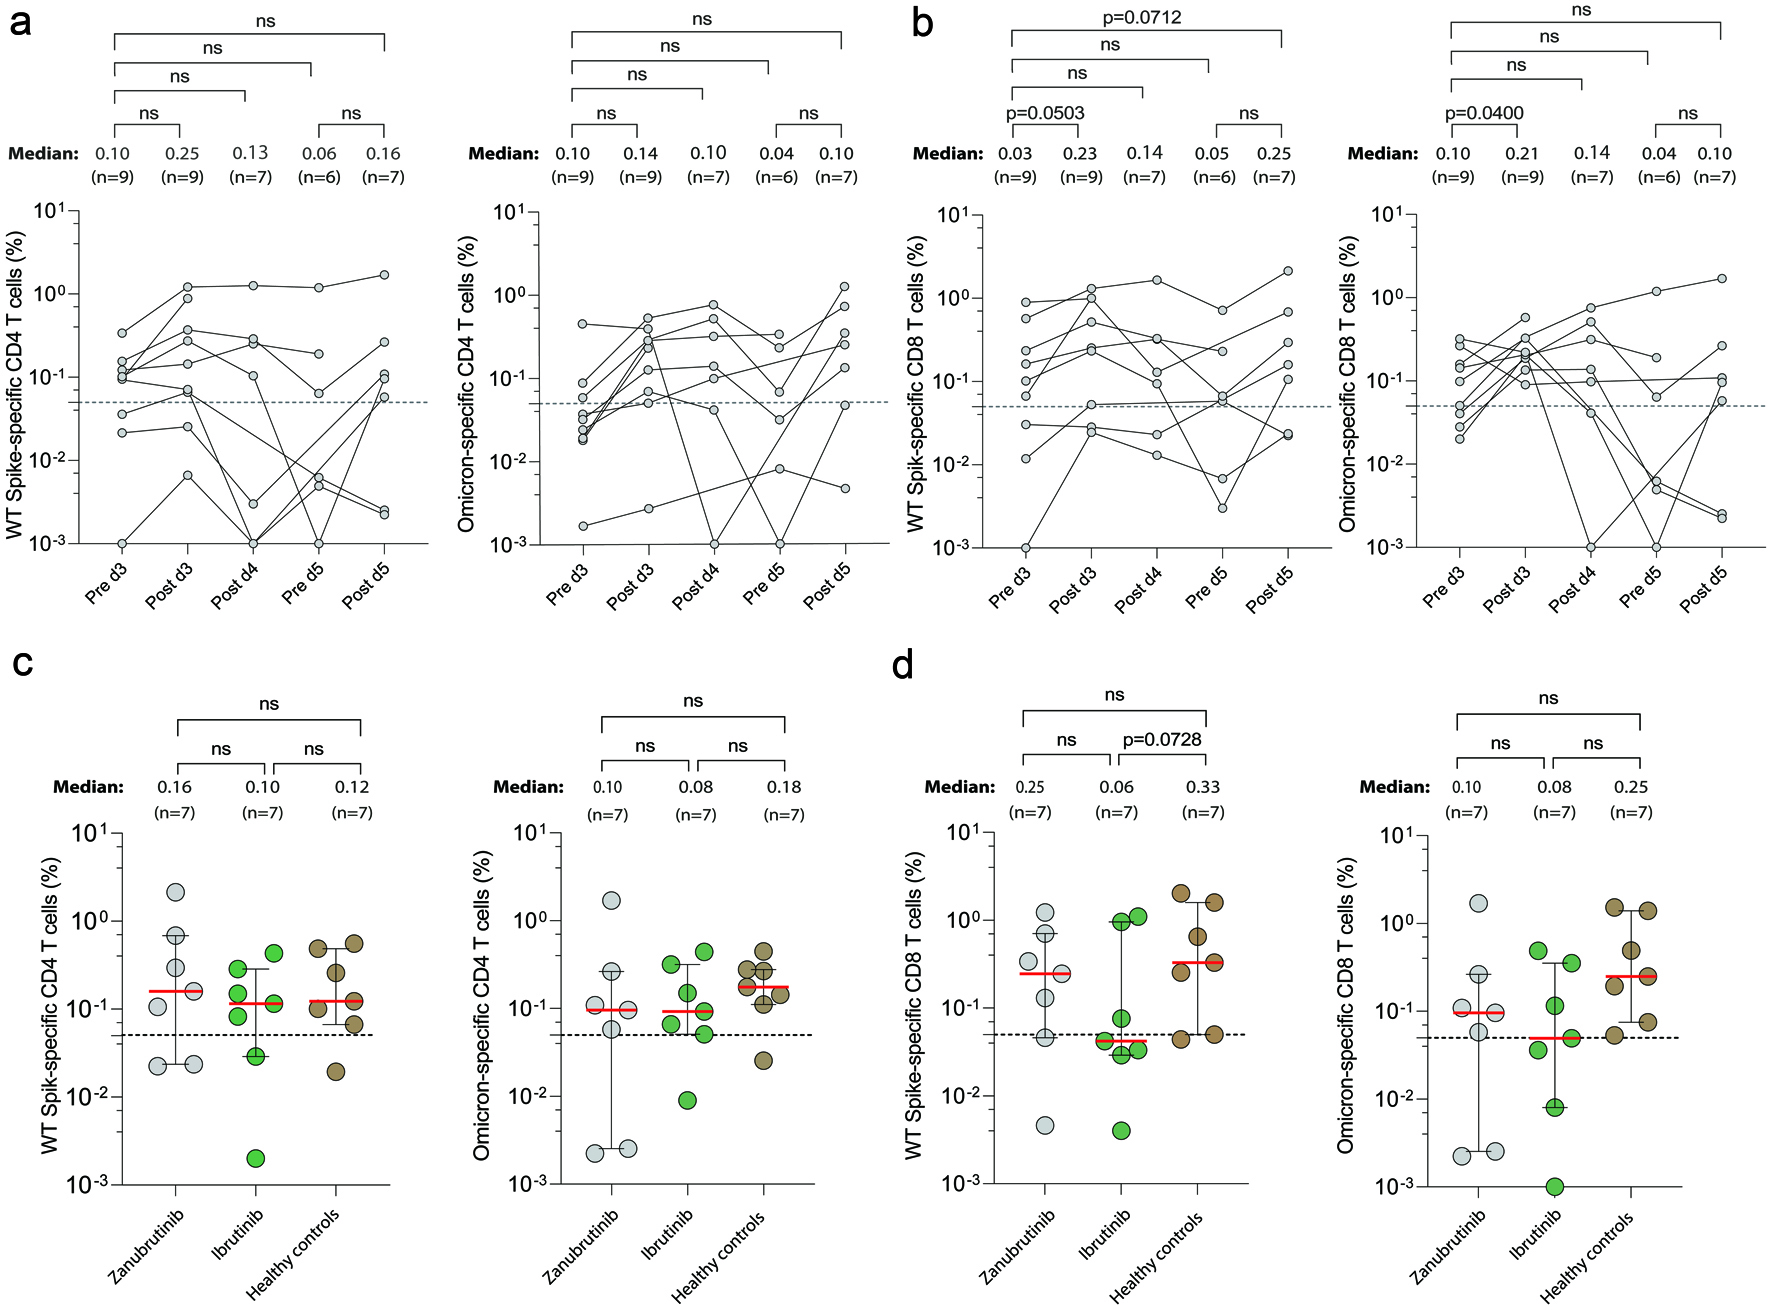
Figure 2. SARS-CoV-2 specific T-cell responses in zanubrutinib- and ibrutinib-treated patients with CLL after SARS-CoV-2 vaccination. Antigen specific CD4+ (CD69+CD154+) and CD8+ (CD69+CD137+) memory T cells were measured after SARS-CoV-2 wild-type and Omicron BA.1 peptide stimulation in PBMC samples from zanubrutinib-treated patients pre- and post-vaccine dose 3, post-dose 4, and pre- and post-dose 5 (a, b), and in addition post-dose 5 in PBMC from seven ibrutinib-treated patients and seven age- and gender-matched healthy donors (c, d). The median level of reactivity and number of samples are indicated above each time point. Omicron-specific CD8+ T cells increased significantly (P < 0.05) after dose 3, and there was a similar trend for wt-specific CD8+ T cells (P = 0.050). No significant differences were noticed between the different groups of patients, or between patients and healthy controls, post-dose 5. Background is subtracted using DMSO negative control of AIM+ CD4+/CD8+ among all patients. A positive response was defined with a cut-off level of 0.05% (dashed lines). Error bars represent the median (red line) and interquartile range where applicable. Non-parametric Kruskal-Wallis test was used to assess differences between all-time points and Mann-Whitney test for comparison between CLL patients and healthy controls. ns: P > 0.05, not statistically significant. CLL: chronic lymphocytic leukemia; PBMC: peripheral blood mononuclear cell.