Figures
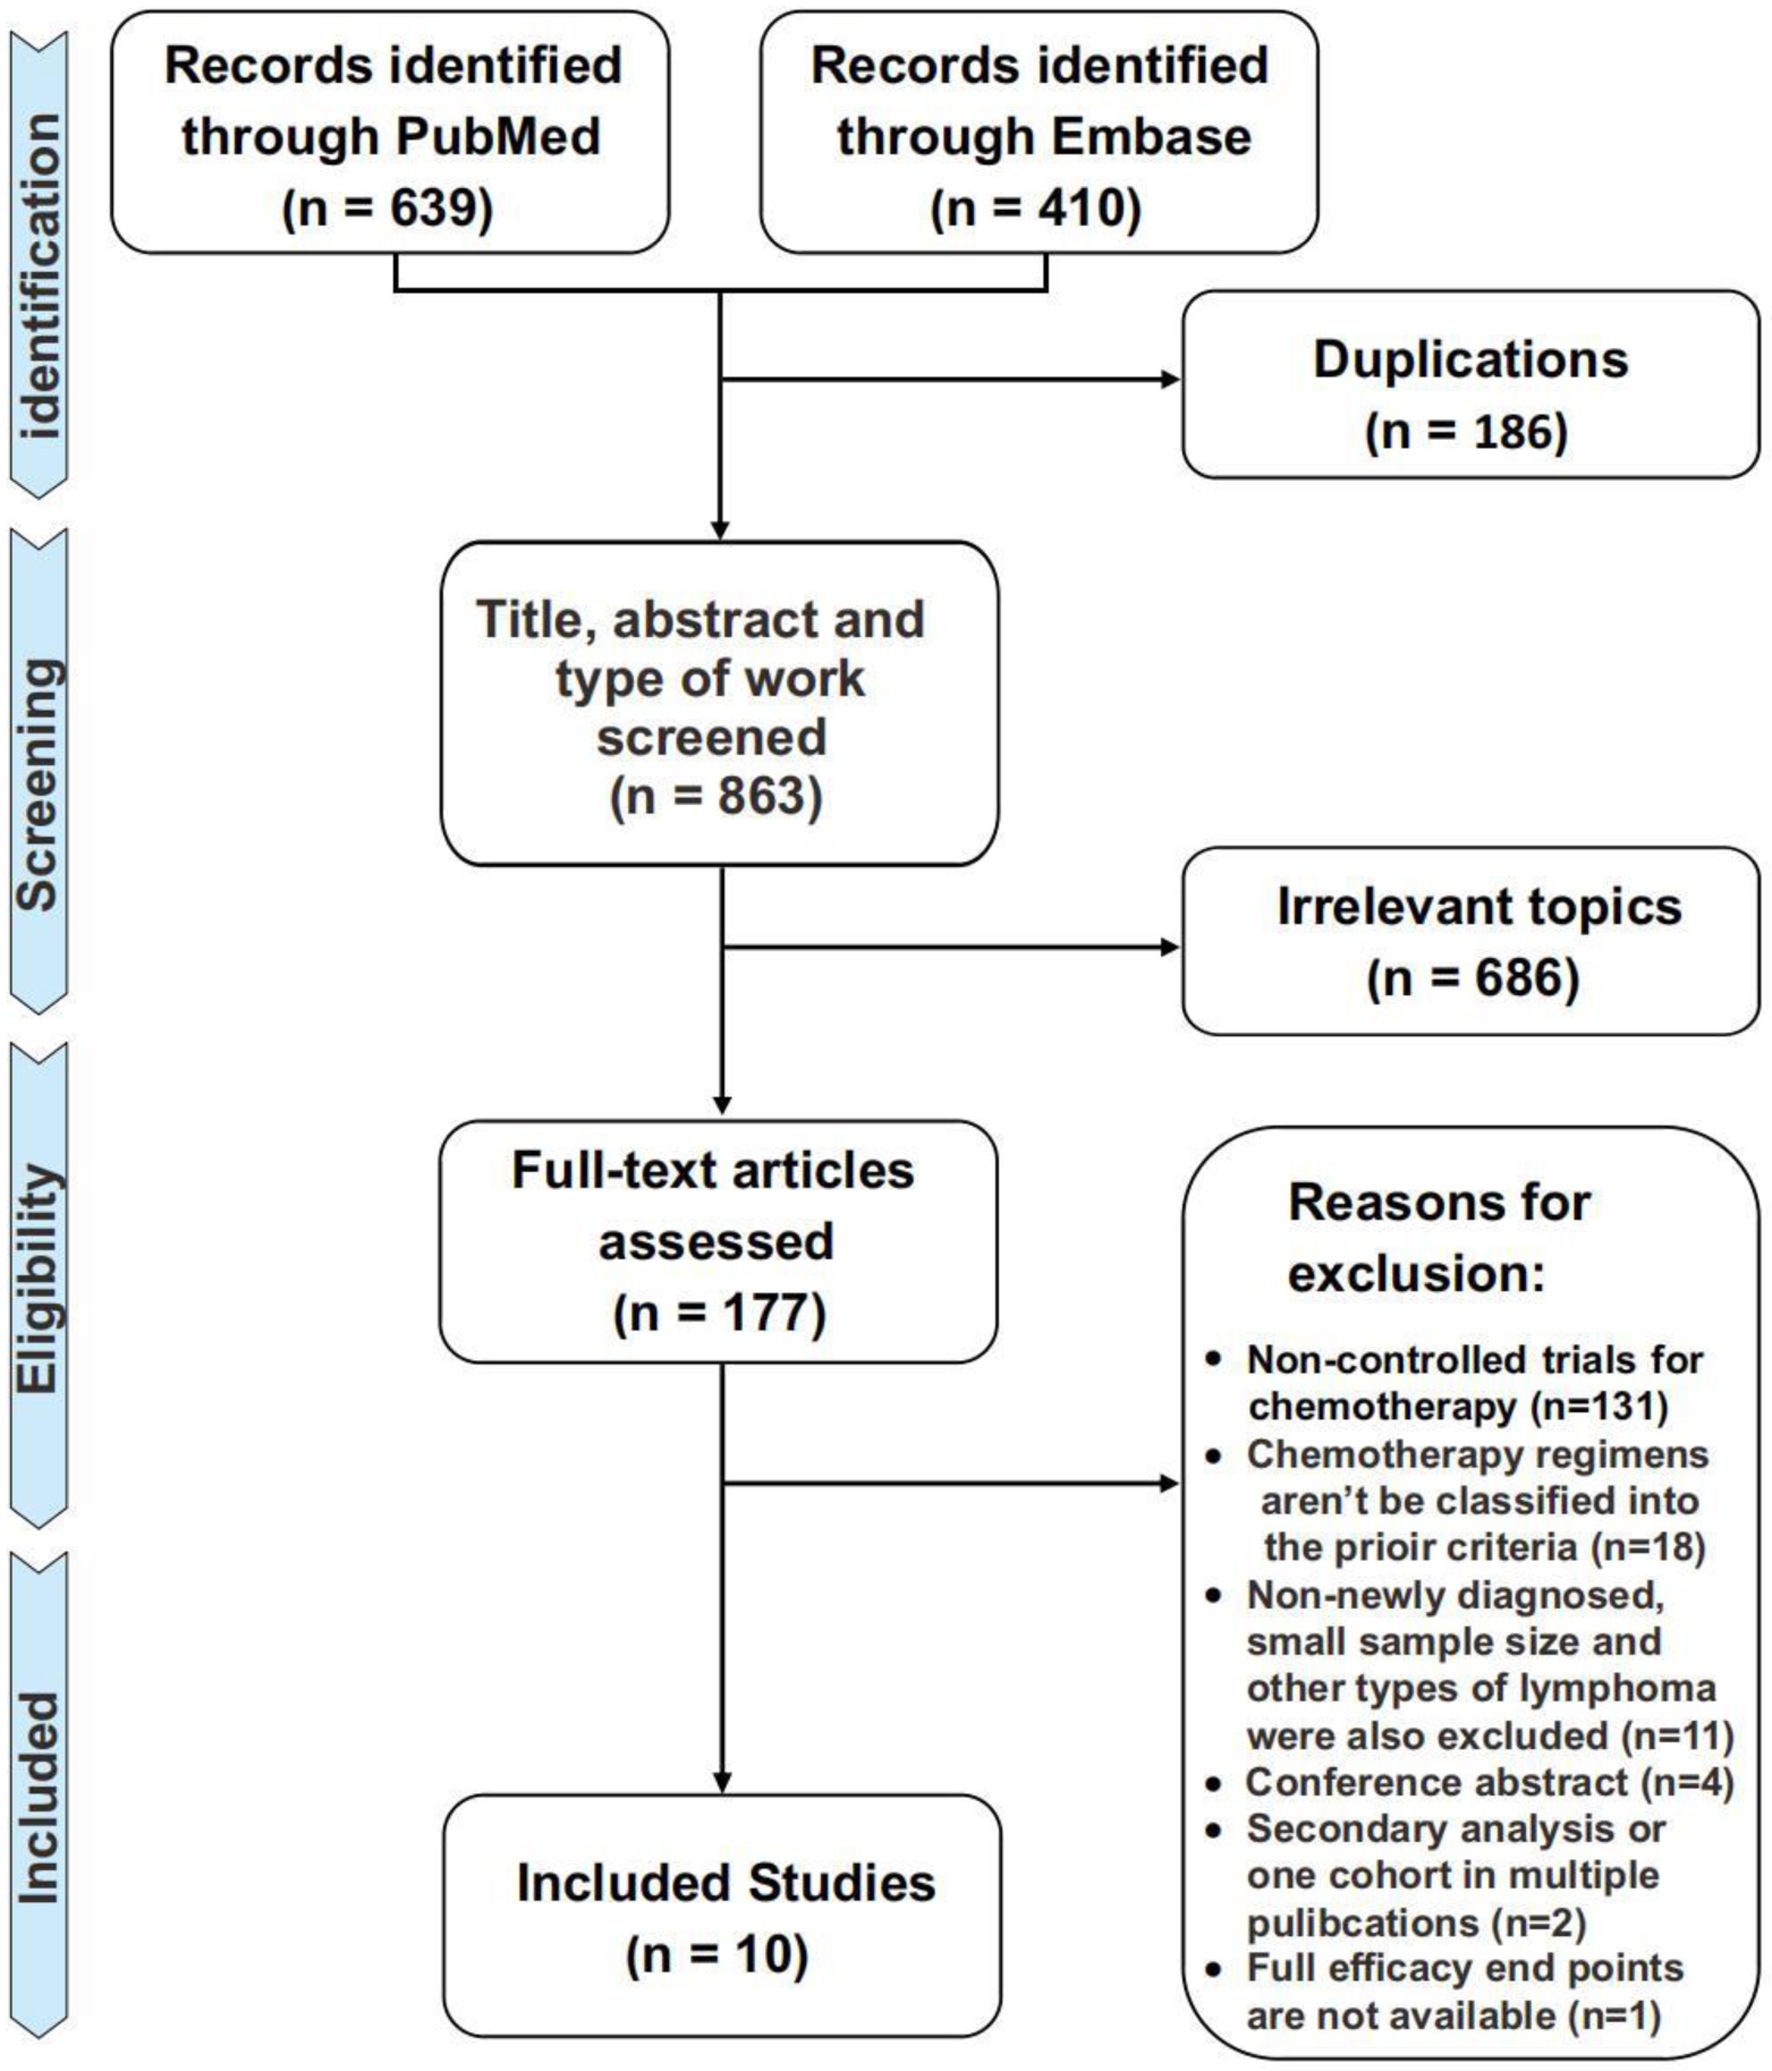
Figure 1. Flow chart of literature search and selection process.
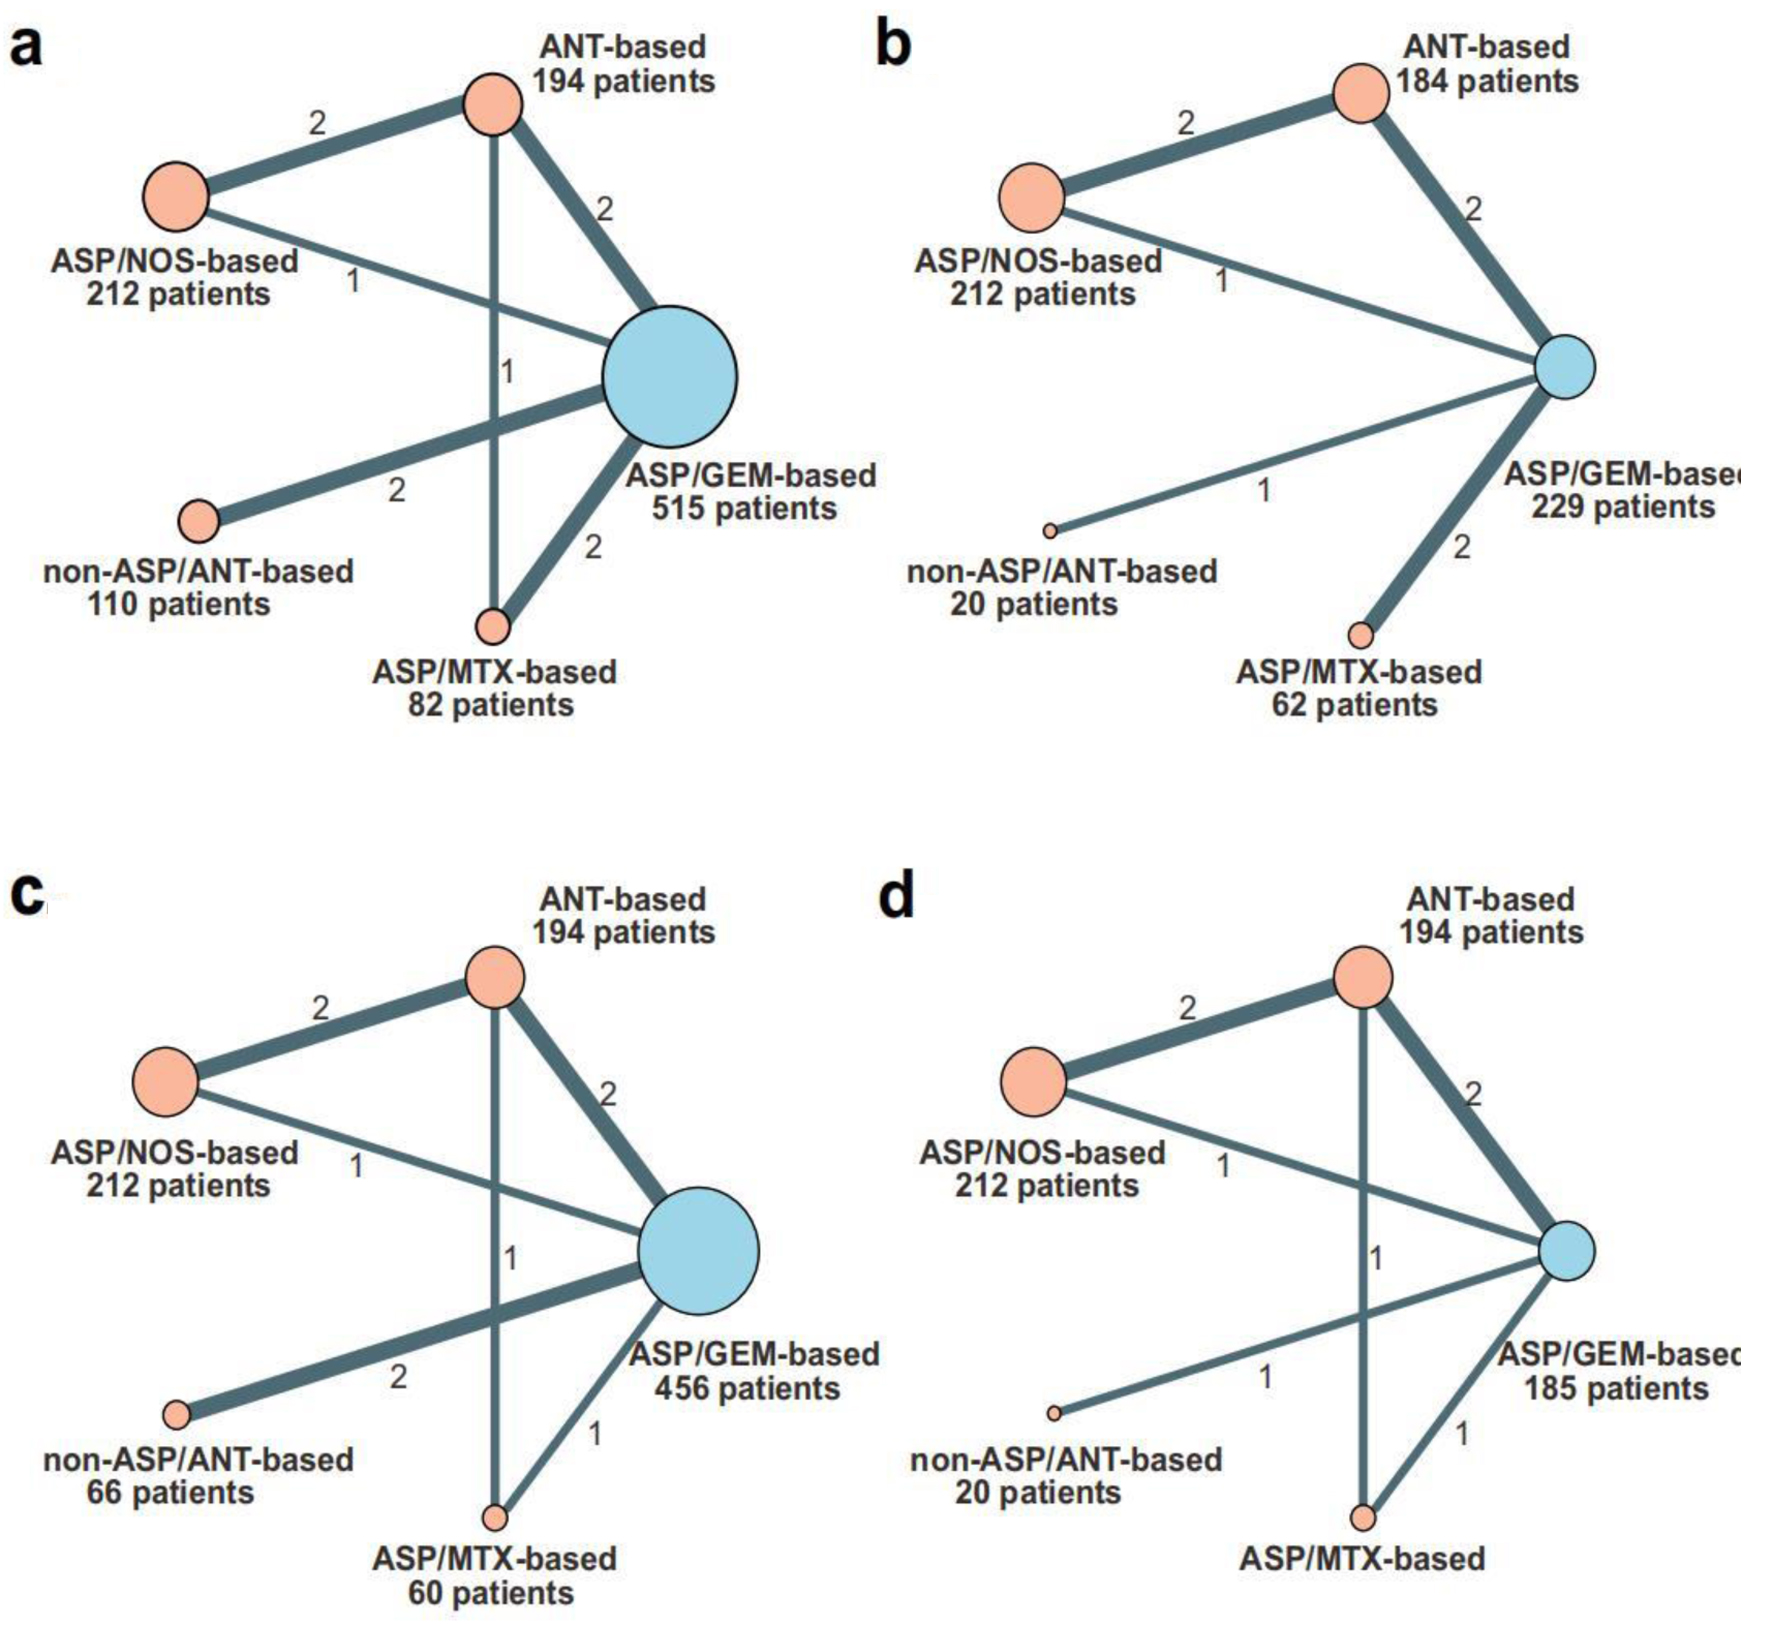
Figure 2. Network diagrams. (a) OS; (b) PFS; (c) ORR; (d) CR. The size of the nodes is proportional to the number of patients, which is given under each treatment category. The width of the lines is proportional to the number of comparisons, which are given on each line. ASP: asparaginase; GEM: gemcitabine; MTX: methotrexate; ANT: anthracycline; NOS: not otherwise specified; OS: overall survival; PFS: progression-free survival; ORR: objective response rate; CR: complete response.
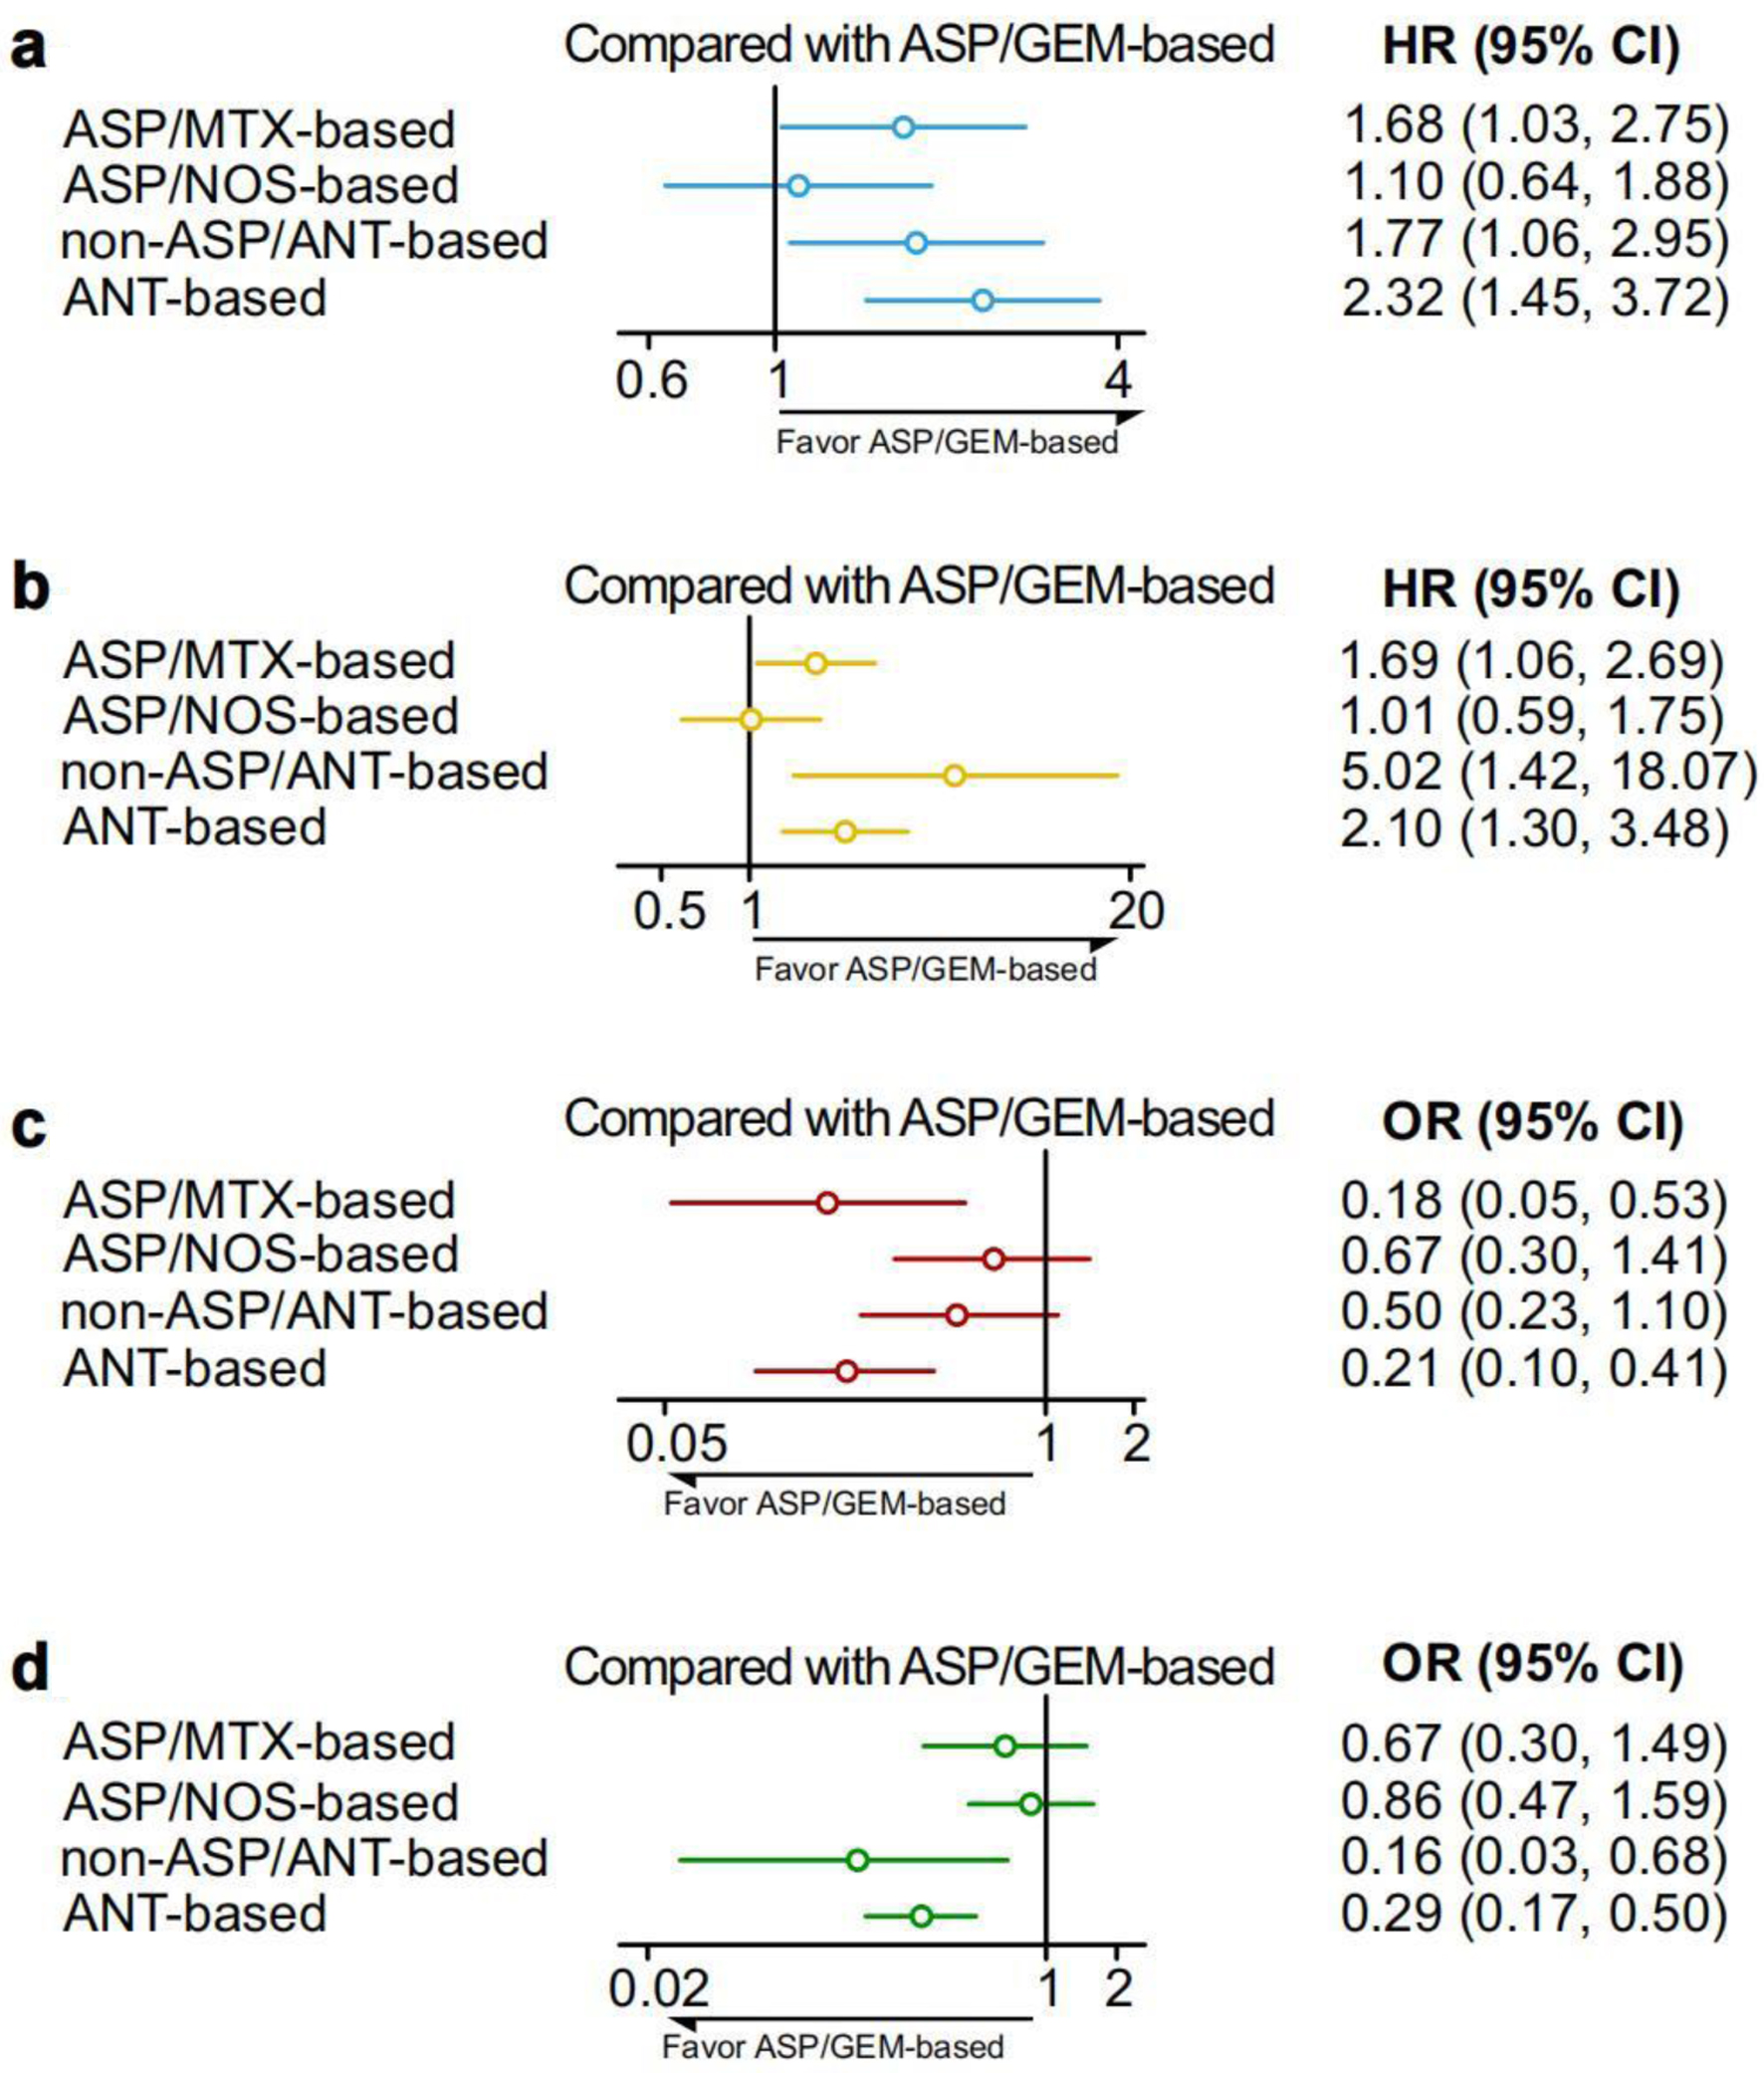
Figure 3. The forest plot shows the effect of five chemotherapy combinations. (a) OS; (b) PFS; (c) ORR; (d) CR. ASP: asparaginase; GEM: gemcitabine; MTX: methotrexate; ANT: anthracycline; NOS: not otherwise specified; OS: overall survival; PFS: progression-free survival; ORR: objective response rate; CR: complete response.
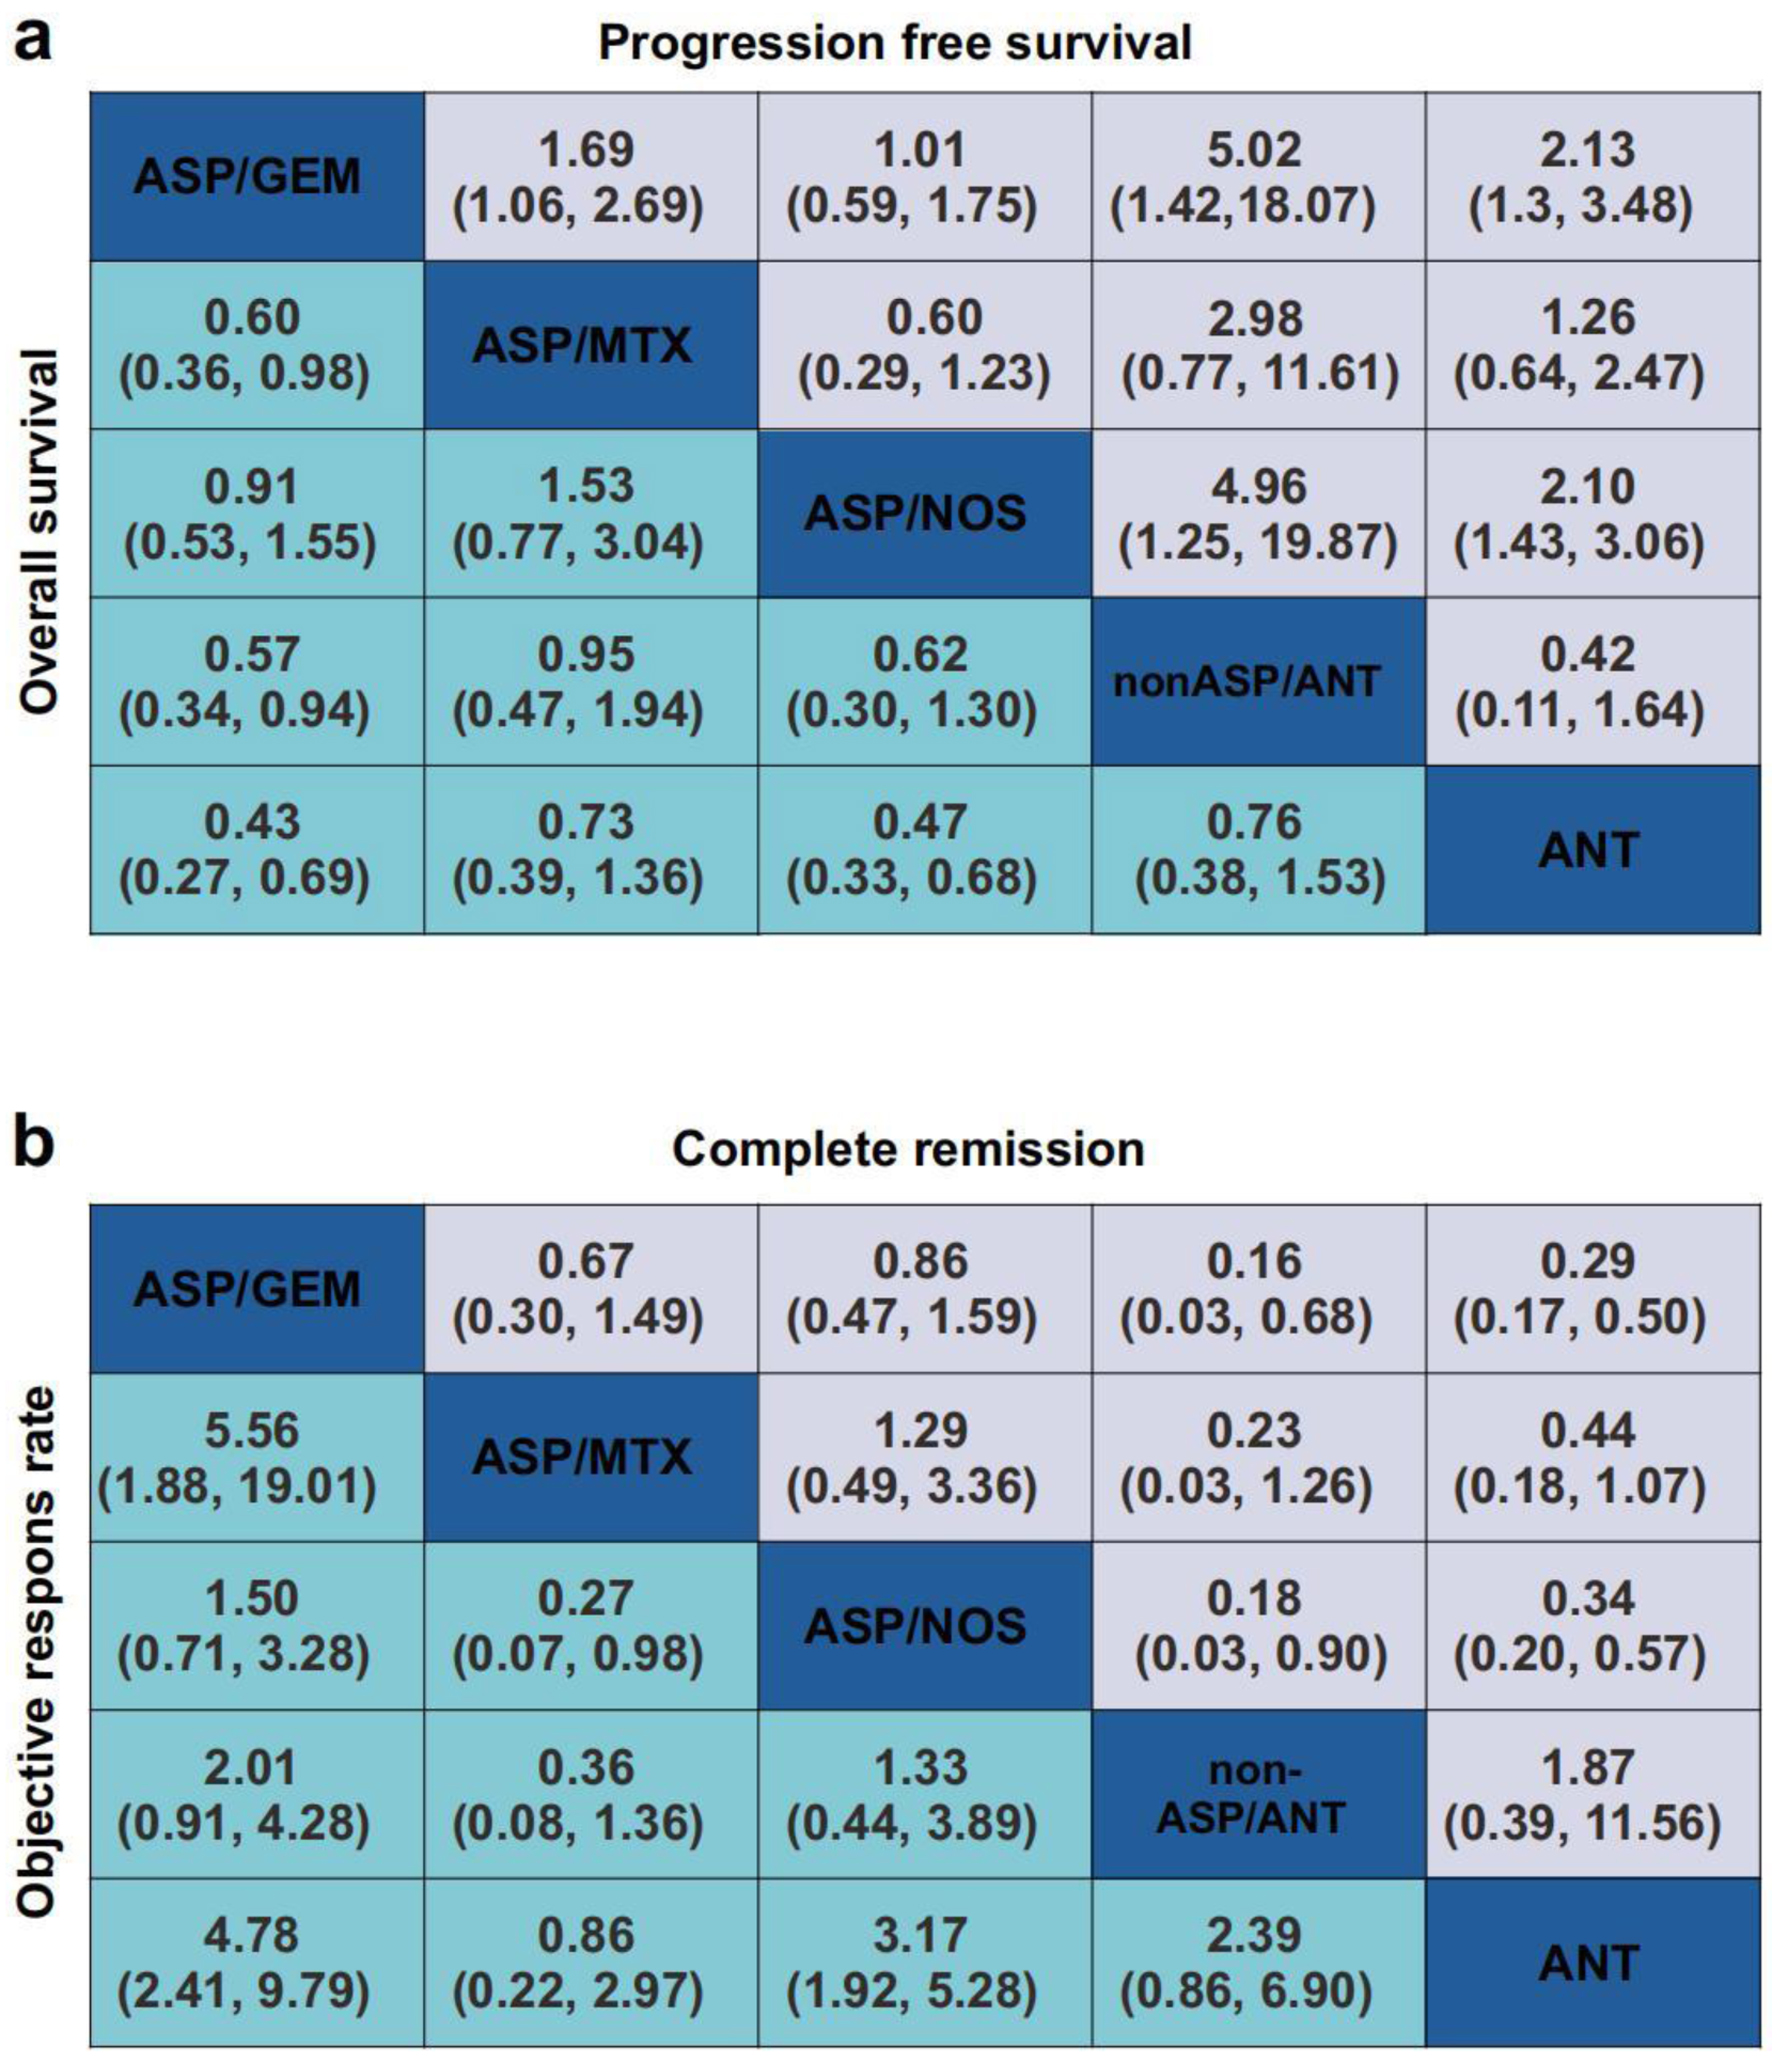
Figure 4. League chart. (a) Combined HR (95% CI) of OS (lower triangle) and PFS (upper triangle). (b) Combined OR (95% CI) of ORR (lower triangle) and CR (upper triangle). The data in each cell are HR or OR (95% CI) comparing row definition processing and column definition processing. HR < 1 or OR > 1 indicates better results. PFS: progression-free survival; OS: overall survival; HR: hazard ratio; OR: odds ratio; ORR: objective response rate; CR: complete response.
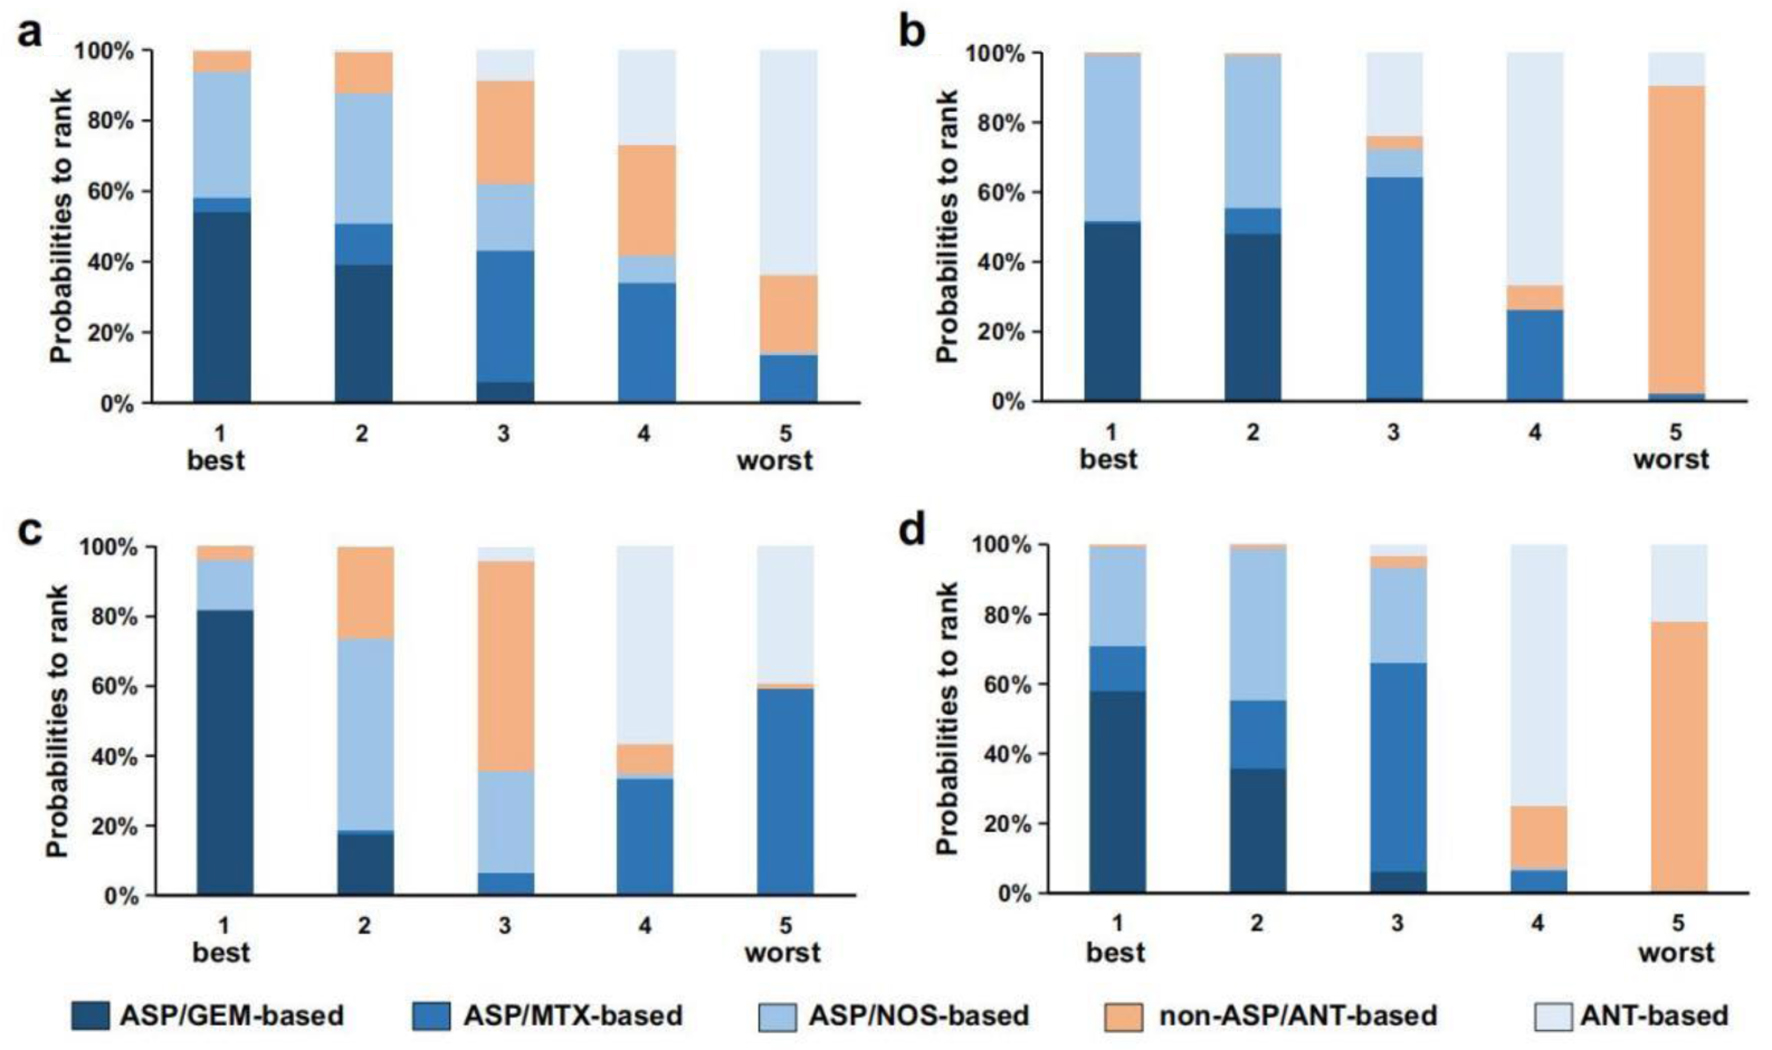
Figure 5. Ranking diagram of five chemotherapy combinations. (a) OS; (b) PFS; (c) ORR; (d) CR. ASP: asparaginase; GEM: gemcitabine; MTX: methotrexate; ANT: anthracycline; NOS: not otherwise specified; OS: overall survival; PFS: progression-free survival; ORR: objective response rate; CR: complete response.
Table
Table 1. Quality Assessment of the Included Studies Based on the Newcastle-Ottawa Scale
| Study | Representativeness of the exposed cohort | Selection of the control cohort | Ascertainment of treatment | Outcome was not present at start | Comparability of cohorts | Assessment of outcome | Follow-up was long enough | Adequacy of follow-up | Overall quality |
|---|
| Wang 2015 [42] | 1 | 1 | 1 | 1 | 1 | 1 | 1 | 0 | 7 |
| Bu 2016 [41] | 1 | 1 | 1 | 1 | 1 | 1 | 1 | 0 | 7 |
| Qi 2016 [40] | 1 | 1 | 1 | 1 | 0 | 1 | 1 | 1 | 7 |
| Zhou 2016 [39] | 1 | 1 | 1 | 1 | 2 | 1 | 0 | 1 | 8 |
| Huang 2017 [38] | 1 | 1 | 1 | 1 | 1 | 1 | 1 | 0 | 7 |
| Wei 2020 [37] | 1 | 1 | 1 | 1 | 1 | 1 | 0 | 1 | 7 |
| Li 2021 [9] | 1 | 1 | 1 | 1 | 0 | 1 | 1 | 1 | 7 |
| Zheng 2021 [36] | 1 | 1 | 1 | 1 | 1 | 1 | 1 | 0 | 7 |
| Wang 2022 [18] | 1 | 1 | 1 | 1 | 2 | 1 | 1 | 1 | 9 |
| Zhang 2022 [35] | 1 | 1 | 1 | 1 | 1 | 1 | 1 | 1 | 8 |